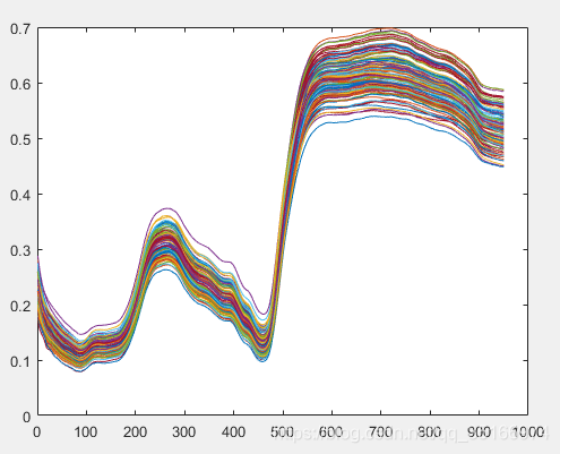
When a near-infrared (NIR) beam hits a grain kernel, a drop of oil, or a compressed tablet, it doesn’t encounter a smooth, uniform surface. Instead, it enters a complex microscopic environment where light is scattered, absorbed, and distorted by uneven structures and moisture.
The mission of Near-Infrared Spectroscopy (NIRS) is to cut through this complexity and accurately extract chemical information. Behind this process are several powerful data-processing and modeling techniques—think of them as the “algorithmic toolkit” that makes NIR analysis reliable.
In this article, we break down the three key challenges in NIR analysis and the practical solutions used to overcome them.
Challenge 1: Scattering Interference – When Light Gets “Lost” in Powders
For powders and granular materials, NIR analysis becomes particularly tricky. Instead of traveling in a straight path, light undergoes multiple reflections and refractions between particles. This scattering effect leads to inconsistent optical paths and distorted spectral signals.
Why This Matters
- Signal intensity becomes unreliable
- Baseline drift and spectral tilt appear
- Quantitative analysis accuracy decreases
Common Preprocessing Solutions
To correct these issues, several mathematical preprocessing methods are widely used:
1. Multiplicative Scatter Correction (MSC)
- Removes scattering effects assumed to be consistent across wavelengths
- Corrects baseline shifts and slope variations
- Commonly used in flour protein analysis and pharmaceutical powders
2. Standard Normal Variate (SNV)
- Normalizes each spectrum by centering and scaling
- Reduces variability caused by surface differences (e.g., roughness, density)
- Ideal for grains, soils, and other solid samples
3. Derivative Algorithms (1st & 2nd derivatives)
- Enhance spectral resolution
- Separate overlapping peaks
- Remove background interference
These preprocessing steps are essential for transforming raw, noisy spectra into usable analytical data.
Challenge 2: Water Interference – The “Dominant Signal” Problem
Water is one of the biggest obstacles in NIR analysis. The O–H bond produces very strong absorption peaks, especially around 1450 nm and 1940 nm.
In samples with high moisture content, this signal can overwhelm weaker but important signals from other components such as proteins or fats.
The Problem
- Water absorption masks key chemical information
- Weak signals become difficult to detect
- Model accuracy decreases
Practical Solution: Derivatives + Wavelength Selection
A common and effective strategy includes:
- Second derivative processing
- Sharpens peaks
- Suppresses broad background signals
- Selective wavelength modeling
- Avoids strong water absorption regions
- Focuses on “clean” spectral windows
For example, once water interference is reduced, fat-related C–H peaks (around 1720 nm) become much clearer and easier to analyze.
Challenge 3: From Spectral “Fingerprint” to Quantitative Results
After cleaning the spectral data, the next step is turning it into meaningful numbers—such as concentration or composition percentages.
This is where chemometric modeling comes in. These models act like a translation system, converting spectral patterns into quantitative outputs.
Two Core Modeling Approaches
1. Partial Least Squares (PLS) Regression
- Extracts latent variables that correlate spectra with concentration
- Handles collinearity effectively
- Strong noise resistance
Advantages:
- Highly robust and widely used
- Suitable for multi-variable analysis
Limitations:
- Requires a large and representative calibration dataset
- Less intuitive to interpret
Applications:
- Grain quality analysis
- Oilseed composition measurement
- Industrial process monitoring
2. Support Vector Machine (SVM)
- Builds classification boundaries in high-dimensional space
- Handles nonlinear relationships effectively
Advantages:
- Works well with small datasets
- Strong performance in classification tasks
Limitations:
- Sensitive to parameter tuning
- Computationally intensive
Applications:
- Authenticity testing (e.g., honey)
- Material sorting (e.g., plastics)
Why These Techniques Matter
NIR spectroscopy is not just about collecting light signals—it’s about interpreting complex data accurately. Without proper preprocessing and modeling:
- Results may be misleading
- Key chemical information may be lost
- Industrial decisions could be affected
By combining optical engineering, mathematical algorithms, and domain expertise, NIR technology can deliver highly reliable results even in challenging conditions.
Conclusion
The accuracy of Near-Infrared Spectroscopy is the result of a sophisticated interplay between physics and data science. From correcting scattering effects to suppressing water interference and building predictive models, each step is critical.
Understanding these underlying principles allows users to:
- Select appropriate analysis methods
- Improve measurement reliability
- Expand NIR applications into more complex scenarios
In short, NIR is not just “reading a spectrum”—it’s a smart process of extracting truth from noise.
https://www.ias-glb.com/industry-news/how-nir-sees-complex-samples.shtml